

Disclaimer: Statistics are a great source of information but they can also be misleading. A big part of the problem is that you usually dont know what data the statistics were created from and 97,3% of all statistic you will find on the internet lack any form of error presentation. I tried to avoid both issues. The raw data, including source links and all formulas can be found on page 2. And whenever i used an (arithmetic) average I also included the mean based on the standard deviation. That being said, dont take this too seriously ;)
Now lets have a look at the Data:
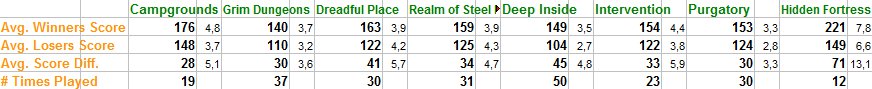
Average Score: No big surprise, the ffa'ish maps Campgrounds and Hidden Fortress have the most overall frags. On the other hand i would have expected Grim Dungeons to have less frags compared to the other maps, the always slightly chaotic play on purgatory for example actually only has a slightly higher amounts of frags per game.
Average Score Difference: Now this is interesting data, but be aware that the errors here a quite huge relative to the score difference. if we look at Dreadful Place with 41 +/- 5,7 and realm of Steel Rats with 34 +/- 4,7 then actually dont see more then a slight tendency and not a 1/5 difference. Same goes for Hidden Fortress that has by far the biggest average difference with 71, but it also has a huge uncertainty (mostly because it was only played 12 times).
But what is interesting afterall, is that we can use the data to answer the question "what map separates the better teams from the worse the most?". Therefore I normalized the score difference with the help of the overall frags, cause a X frag difference on a low scoring map like Grim Dungeons means mroe than the same X frag difference on a high scoring map like Hidden Fortress. Here is what i got:
Playcount (Popularity?): Campgrounds and Hidden Fortress were not in all of the Mappools so they cant really be compared to the rest. Also its improtant to note that except for the EMS all other tournaments had a drop, drop, pick, pick system so not every was able to play their most favorite map.
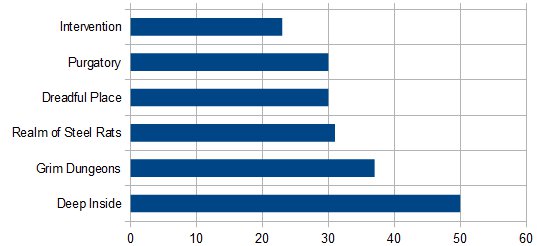
We can see three things, Deep Inside is a clear favorite, Intervention falls short and the new maps seemed to have integrated really fine, especially considering that they got played more and more the longer they were in the mappool.
So much for the Average, lets have a look at the records aswell:
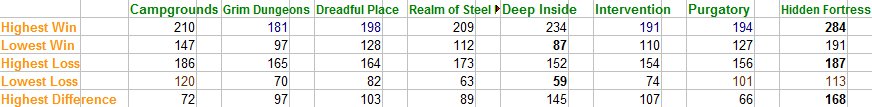
Hidden Fortress takes away Highest Win (284!), Highest Loss and Highest Score Difference (158!) while Deep Inside gets Lowest Win (87!) and Lowest Loss.
Interesting to note is that no team has managed to get 200+ on Grim Dungeons, Dreadful Place, Intervention and Purgatory. But it was close a few times so watch out who will manage to do so the first time. On the other side of the spectrum it is worth mentioning that no team has controlled their opponent well enough so far to keep them below 100 on Campgrounds, Purgatory and Hidden Fortress.
If you are interested in the separate stats for single tournaments or wanna haw a look at the raw data check out Page 2. Feel free to edit/update and do with it whatever you want.
Now lets have a look at the Data:
Average Score: No big surprise, the ffa'ish maps Campgrounds and Hidden Fortress have the most overall frags. On the other hand i would have expected Grim Dungeons to have less frags compared to the other maps, the always slightly chaotic play on purgatory for example actually only has a slightly higher amounts of frags per game.
Average Score Difference: Now this is interesting data, but be aware that the errors here a quite huge relative to the score difference. if we look at Dreadful Place with 41 +/- 5,7 and realm of Steel Rats with 34 +/- 4,7 then actually dont see more then a slight tendency and not a 1/5 difference. Same goes for Hidden Fortress that has by far the biggest average difference with 71, but it also has a huge uncertainty (mostly because it was only played 12 times).
But what is interesting afterall, is that we can use the data to answer the question "what map separates the better teams from the worse the most?". Therefore I normalized the score difference with the help of the overall frags, cause a X frag difference on a low scoring map like Grim Dungeons means mroe than the same X frag difference on a high scoring map like Hidden Fortress. Here is what i got:
0,39 - Hidden FortressPleased to see how bad Campgrounds is, reconfirmed that Deep Inside is awesome. But afterall I just mentioned the huge error margins so this should be taken with a grain of salt, especially Hidden Fortress that had the biggest uncertainty and adding the sheer lack of practice for teams on the map the lead is quite questionable. But still, who would have expected it to be #1.
0,35 - Deep Inside
0,29 - Dreadful Place
0,24 - Grim Dungeons
0,24 - Realm of Steel Rats
0,24 - Intervention
0,21 - Purgatory
0,17 - Campgrounds
Playcount (Popularity?): Campgrounds and Hidden Fortress were not in all of the Mappools so they cant really be compared to the rest. Also its improtant to note that except for the EMS all other tournaments had a drop, drop, pick, pick system so not every was able to play their most favorite map.
We can see three things, Deep Inside is a clear favorite, Intervention falls short and the new maps seemed to have integrated really fine, especially considering that they got played more and more the longer they were in the mappool.
So much for the Average, lets have a look at the records aswell:
Hidden Fortress takes away Highest Win (284!), Highest Loss and Highest Score Difference (158!) while Deep Inside gets Lowest Win (87!) and Lowest Loss.
Interesting to note is that no team has managed to get 200+ on Grim Dungeons, Dreadful Place, Intervention and Purgatory. But it was close a few times so watch out who will manage to do so the first time. On the other side of the spectrum it is worth mentioning that no team has controlled their opponent well enough so far to keep them below 100 on Campgrounds, Purgatory and Hidden Fortress.
If you are interested in the separate stats for single tournaments or wanna haw a look at the raw data check out Page 2. Feel free to edit/update and do with it whatever you want.